What is a data dashboard?

A dashboard is a comprehensive, one-page, visual display of summary data and information that serves as a reporting mechanism to help improve decision-making.

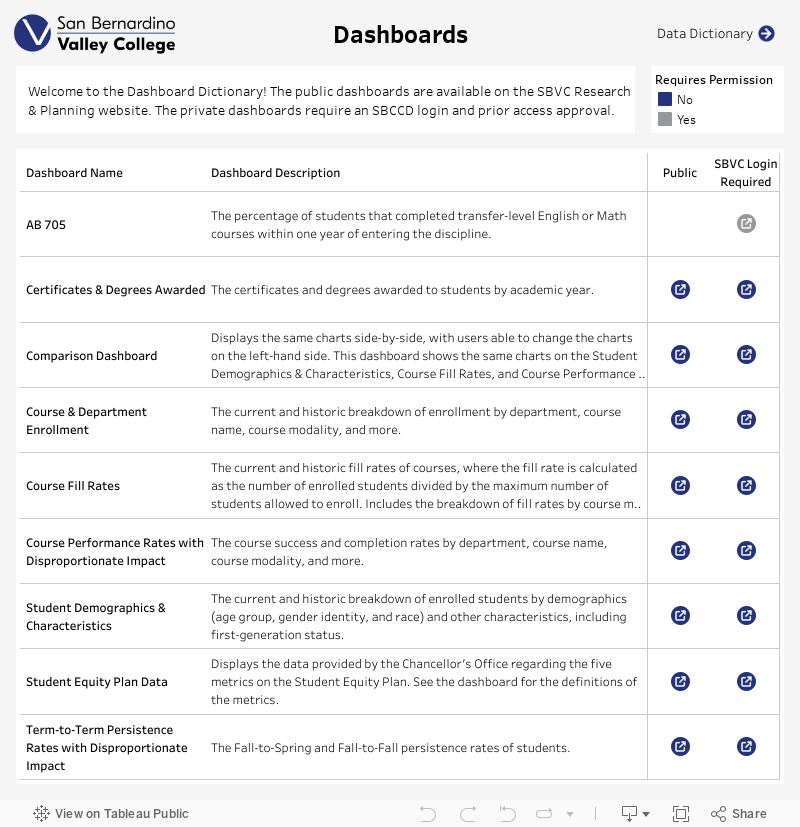
The available dashboards are listed below with details about what can be found on each dashboard.

Dashboard
Resources &
Trainings
    Dashboard
Feedback &
Requests
    Valley
Employee
Dashboards

Available Dashboards

  • View the Student Demographics Dashboard

    This dashboard shows the current and trend views for the headcount and seat count of enrolled students by age group, gender identity, and race.


    Relevant Metrics and Goals:

    • Educational Master Plan Goal 2: Be a Diverse, Equitable, Inclusive, and Anti-Racist Institution
    • Educational Master Plan Strategic Direction 5: Utilize Quantitative and Qualitative Data to Understand Our Students' Lived Experiences and Better Support Them Towards Their Goals

    Available Filters:

    • Demographics (Age Group, Gender Identity, Race)
    • Special Populations (Disability, First-Generation, Foster Youth, Veteran)
    • Student Characteristics (Support Programs, Unit Load Status, First-Time Student Status)
    • Course Information (Division, Department, Course Name, Course Modality)
  • View the Department & Course Enrollment Dashboard

    This dashboard shows the current and trend views for headcount and seat count by department, course, modality, and course level.


    Relevant Metrics and Goals:

    • Educational Master Plan Goal 1: Eliminate Barriers to Student Access & Success
    • Educational Master Plan Strategic Direction 2: Innovate Curriculum and Course Offerings to Support Student Equity and Completion
    • Educational Master Plan Strategic Direction 5: Utilize Quantitative and Qualitative Data to Understand Our Students' Lived Experiences and Better Support Them Towards Their Goals

    Available Filters:

    • Demographics (Age Group, Gender Identity, Race)
    • Special Populations (Disability, First-Generation, Foster Youth, Veteran)
    • Student Characteristics (Support Programs, Unit Load Status, First-Time Student Status)
    • Course Information (Division, Department, Course Name, Course Modality)
  • View the Course Fill Rates Dashboard

    This dashboard shows the current and trend views for course fill rates by department, course, modality, start time, length of course, and course level.

    Course fill rates are calculated by: (# of Enrolled Students) ÷ (Maximum # of Seats)


    Relevant Metrics and Goals:

    • Educational Master Plan Goal 1: Eliminate Barriers to Student Access & Success
    • Educational Master Plan Strategic Direction 2: Innovate Curriculum and Course Offerings to Support Student Equity and Completion

    Available Filters:

    • Course Information (Division, Department, Course Name, Course Modality, Course Level, Start Time of Course, Number of Weeks)
  • View the Performance Rates Dashboard

    This dashboard shows the course success and course completion rates for completed terms. This dashboard includes the disproportionate impact trends disaggregated by age group, gender identity, and race.


    Relevant Metrics and Goals:

    • Educational Master Plan Goal 1: Eliminate Barriers to Student Access & Success
    • Educational Master Plan Goal 2: Be a Diverse, Equitable, Inclusive, and Anti-Racist Institution
    • Educational Master Plan Strategic Direction 2: Innovate Curriculum and Course Offerings to Support Student Equity and Completion
    • Educational Master Plan Strategic Direction 5: Utilize Quantitative and Qualitative Data to Understand Our Students' Lived Experiences and Better Support Them Towards Their Goals
    • Student Equity Plan and Guided Pathways: Completion of Transfer-Level Math and English

    Available Filters:

    • Course Information (Division, Department, Course Name, Course Modality, Course Level)
    • Special Populations (Disability, First-Generation, Foster Youth, Veteran)
    • Support Programs
    • Demographic information is only included on the Disproportionate Impact view
  • View the Academic Programs & Educational Goals Dashboard

    This dashboard shows the current and trend views for the number of students (headcount) within each Academic Program and Educational Goal.


    Relevant Metrics and Goals:

    • Educational Master Plan Strategic Direction 3: Expand and Align Support Services and Resources in Conjunction with Student Pathways
    • Educational Master Plan Strategic Direction 5: Utilize Quantitative and Qualitative Data to Understand Our Students' Lived Experiences and Better Support Them Towards Their Goals
    • Educational Master Plan Strategic Direction 8, Supporting Action 4: Demonstrate responsiveness to community needs with regard to certificates, degrees, and programs

    Available Filters:

    • Demographics (Age Group, Gender Identity, Race)
    • Special Populations (Disability, First-Generation, Foster Youth, Veteran)
    • Student Characteristics (Support Programs, Unit Load Status, First-Time Student Status)
    • Academic Program Information (Career & Academic Pathway (CAP), Division, Department, Award Type, Program Title, CTE Status, STEM Status)
    • Educational Goal
  • View the Certificates & Degrees Awarded Dashboard

    This dashboard shows the number of degrees and certificates awarded by academic year. Demographic, snapshot, and trend views are included.


    Relevant Metrics and Goals:

    • Educational Master Plan Strategic Direction 2: Innovate Curriculum and Course Offerings to Support Student Equity and Completion
    • Educational Master Plan Strategic Direction 5: Utilize Quantitative and Qualitative Data to Understand Our Students' Lived Experiences and Better Support Them Towards Their Goals
    • Educational Master Plan Strategic Direction 7: Connect Students to Regional and Community Opportunities
    • Educational Master Plan Strategic Direction 8, Supporting Action 4: Demonstrate responsiveness to community needs with regard to certificates, degrees, and programs
    • Student Equity Plan and Guided Pathways: Vision Goal Completion

    Available Filters:

    • Demographics (Age Group, Gender Identity, Race)
    • Special Populations (Disability, First-Generation, Foster Youth, Veteran)
    • Student Characteristics (Support Programs, Unit Load Status, First-Time Student Status)
    • Academic Program Information (Career & Academic Pathway (CAP), Division, Department, Award Type, Program Title, CTE Status, STEM Status)
  • View the Persistence Rates Dashboard

    This dashboard shows the Fall-to-Spring and Fall-to-Fall persistence rates. Demographic and trend views are included.


    Relevant Metrics and Goals:

    • Educational Master Plan Strategic Direction 2: Innovate Curriculum and Course Offerings to Support Student Equity and Completion
    • Educational Master Plan Strategic Direction 5: Utilize Quantitative and Qualitative Data to Understand Our Students' Lived Experiences and Better Support Them Towards Their Goals
    • Student Equity Plan: Persistence from Primary to Secondary Term

    Available Filters:

    • Demographics (Age Group, Gender Identity, Race)
    • Special Populations (Disability, First-Generation, Foster Youth, Veteran)
    • Support Programs
  • View the Student Equity Plan Dashboard

    This dashboard displays the data related to the five metrics on the Student Equity Plan. All data on this dashboard is provided by the California Community College's Chancellor's Office.

    Available Filters:

    • Metric
    • Chart Type (Line vs. Block Chart)
    • Academic Year Students' Started
    • Demographics (Age Group, Gender Identity, Race)
    • Special Populations (Disability, First-Generation, Foster Youth, Veteran)
    • Other Student Characteristics (Homeless, LGBT, Perkins Economically Disadvantaged)